Why a Century of Health Research Still Struggles to Explain How We Feel
- 1 hour ago
- 5 min read
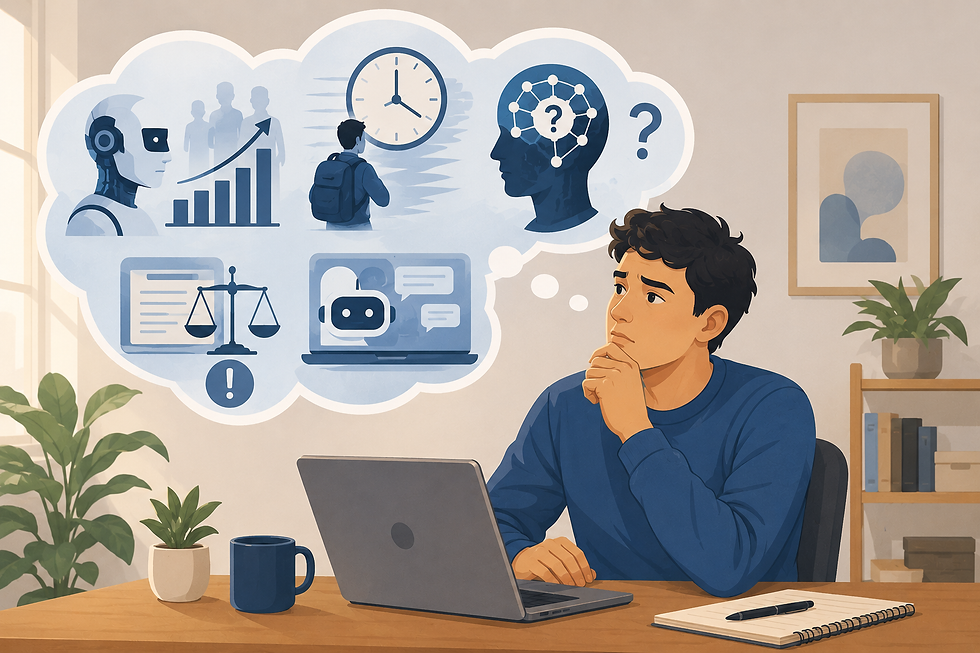
We’ve touched on this before, but it’s worth revisiting. We sleep eight hours yet still feel wrecked. Our wearable says recovery is fine but our focus is nonexistent. We have the data behind the feeling but what about understanding the feeling itself? How do we interpret how we feel to know the “why” behind it? The whole health field was effectively built on a foundation intended to answer one question…“Are we sick?” Nearly every metric, measurement, and treatment inherited that framing. Readiness and proactive improvement was never really the focus until recently.
Adequate sleep, a clean blood panel, a checkbox from the doc, and a recovery score that says we’re peaking, but we still drag through the morning, miss the obvious answer in a meeting, or snap at someone we love over nothing. The metrics say we’re fine. The feeling says otherwise. We’ve never had more health information available to us, yet it seems we’ve never been more confused about what to do with it.
That confusion is the predictable result of the question medicine and health research was built to answer.

How Did Modern Medicine Evolve?
Modern medicine was built to find disease, not to explain how we feel. Nearly every biomarker, every reference range, and every blood panel we recognize today emerged from the goal to define what is considered “wrong” so it can be treated. The work was scaffolded around pathology because pathology is what kills people, and that’s the work that needed doing.
The numbers on our lab reports come from this basis. The concept of a reference interval, which is the range of values considered normal for a given test, was formally introduced into clinical chemistry in 1969 and is essentially a statistical answer to a clinical question. A value is normal if it falls within the central 95% of measurements from healthy volunteers (The definitions “healthy volunteers” of many studies, especially older ones still used today, introduce a whole different set of challenges that we’ll explore another time). Anything outside that band gets flagged as a potential signal of pathology, but if we fall inside it, the system says we’re fine.
What that framing struggles to measure is the part we actually live in and experience. We can sit inside every reference range on a chart and still be cooked. Many of these measures weren’t designed to tell us how we’re doing today and why we feel like sh*t. The system was designed to tell us whether something is truly broken, which is incredibly valuable but incomplete in modern life. All the feelings and experiences we have before we’re “truly broken” exist at a different layer of analysis and require different instruments.
A 1977 paper in Science argued that the dominant biomedical model was reductive and dualist, leaving no room for the psychological, behavioral, and social dimensions of how someone actually experiences their own health. The paper proposed a biopsychosocial model in its place. Almost fifty years later, that model has been discussed endlessly in academic settings; adoption is fragmented at best as the operational frame for measuring a person, but it also inspired Aypex to carve a new path forward. For now though, the reference interval still rules the health charts, and our lived experience still falls through the cracks.
Why Doesn’t Having More Data Close the Gap?
The wearable revolution doesn’t seem to be closing the gap between data and experience. The main effect seems to be that it made the gap easier to see. The fitness boom of the 1970s and 1980s introduced a parallel measurement culture of heart rate zones, body composition, and oxygen uptake during exercise. It grew up next to clinical medicine without ever fully connecting to it. Pew Research found that by 2019, 21% of American adults were regularly wearing a fitness tracker or smartwatch. Rock Health's Digital Health Consumer Adoption Survey reported that by 2023, the figure had reached 44%. Nearly half the U.S. is now generating continuous biometric data, but it’s only now, with the help of AI, that it’s starting to get connected to other parts of our lives.
This is the structural problem more than anything. Mental health became its own discipline with its own diagnostic categories. Sleep science grew into its own field with its own metrics. Cognitive performance and physical optimization built parallel vocabularies. All of them act on the same person, yet each area struggles to talk with each other.
The pipes don’t connect. A normal HRV reading doesn’t know that we’ve been ruminating since 3 a.m. A clean lipid panel doesn’t know that the last three weeks of work have been quietly hollowing us out. The metrics live in separate buckets because the disciplines that produced them were built in separate buildings.
Health Research Still Struggles
The lived experience of the gap between data and feeling has likely been felt by all of us. Our ring tells us we slept well and we still wake up flat. Our HRV from the watch sits in the green zone, yet we still can’t put two thoughts together by 2 p.m. Our bloodwork is clean and our energy still crashes by lunch. The metrics are reporting on a different question than the one our body is actually answering.
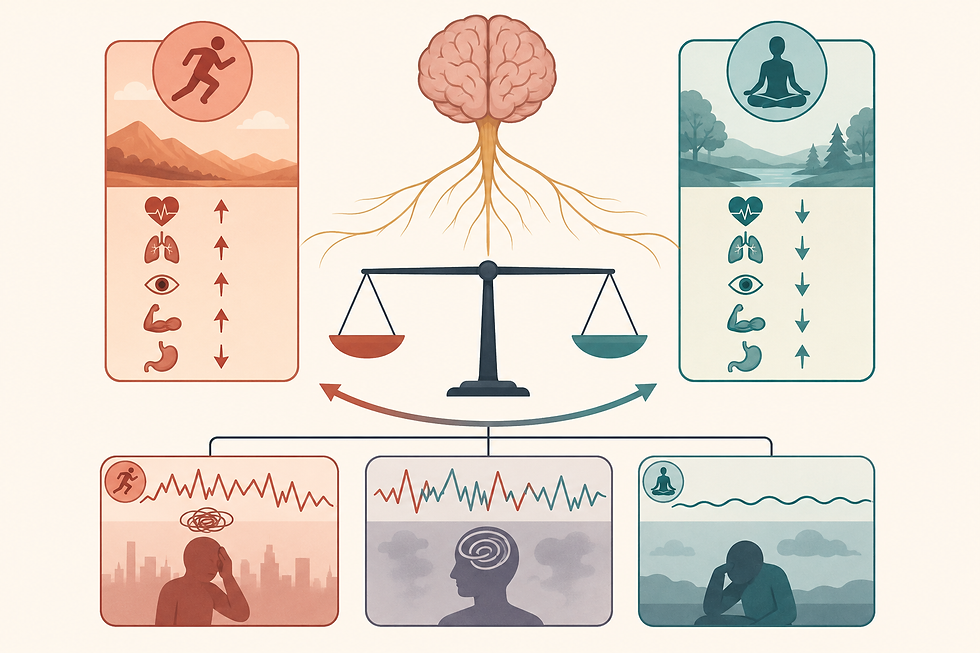
Much of this is captured in the science already, but usually not where most people can find it. The allostatic load model, introduced in 1993, describes the cumulative cost of staying activated for too long. The strain shows up across multiple systems at once, including neuroendocrine, cardiovascular, metabolic, immune. The brain stays activated, hormones drift, sleep gets shallow, focus narrows, and the cost shows up everywhere at once but also nowhere in particular. It is a system-level read on a system-level problem, but it’s rarely on anyone's home screen or presented in a way that’s easily understandable. Other research points in the same direction, but it hasn’t been operationalized yet in a way that’s accessible.
Where Readiness Lives
The frustration of looking at green metrics while feeling red is a near-universal experience. It’s the result of a hundred-year-old question that built the architecture of nearly every health measurement we now use. The wearable isn’t wrong and the blood panel is still useful, but they don’t see the whole picture. Once we see that, the experience stops being confusing and starts making sense. The gap between data and feeling is what Aypex set out to solve. We’re not there yet, but we’re on the way to making how we feel make more sense.
References
Engel, G. L. (1977). The need for a new medical model: A challenge for biomedicine. Science, 196(4286), 129–136. https://doi.org/10.1126/science.847460
Gräsbeck, R., & Saris, N. E. (1969). Establishment and use of normal values. Scandinavian Journal of Clinical and Laboratory Investigation, 26(Suppl 110), 62–63.
McEwen, B. S., & Stellar, E. (1993). Stress and the individual: Mechanisms leading to disease. Archives of Internal Medicine, 153(18), 2093–2101. https://doi.org/10.1001/archinte.1993.00410180039004
McEwen, B. S. (1998). Stress, adaptation, and disease: Allostasis and allostatic load. Annals of the New York Academy of Sciences, 840(1), 33–44. https://doi.org/10.1111/j.1749-6632.1998.tb09546.x
Geisler, F. C., Vennewald, N., Kubiak, T., & Weber, H. (2010). The impact of heart rate variability on subjective well-being is mediated by emotion regulation. Personality and Individual Differences, 49(7), 723–728. https://doi.org/10.1016/j.paid.2010.06.015
Hannon, J., O'Hagan, A., Lambe, R., O'Grady, B., & Doherty, C. (2025). Associations between daily heart rate variability and self-reported wellness: A 14-day observational study in healthy adults. Sensors, 25(14), 4415. https://doi.org/10.3390/s25144415
Vogels, E. A. (2020). About one-in-five Americans use a smart watch or fitness tracker. Pew Research Center. https://www.pewresearch.org/short-reads/2020/01/09/about-one-in-five-americans-use-a-smart-watch-or-fitness-tracker/
Rock Health. (2024). Put a ring on it: Understanding consumers' year-over-year wearable adoption patterns. Rock Health Digital Health Consumer Adoption Survey 2023. https://rockhealth.com/insights/put-a-ring-on-it-understanding-consumers-year-over-year-wearable-adoption-patterns/